During the pandemic, we wanted a way to ensure our members felt safe and comfortable to come back to our gyms. One way to make members comfortable was to show how crowded our gyms were at any given time. We used our integration with MotionSoft, our front desk software, to calculate capacity (current checked-in members divided by total capacity).
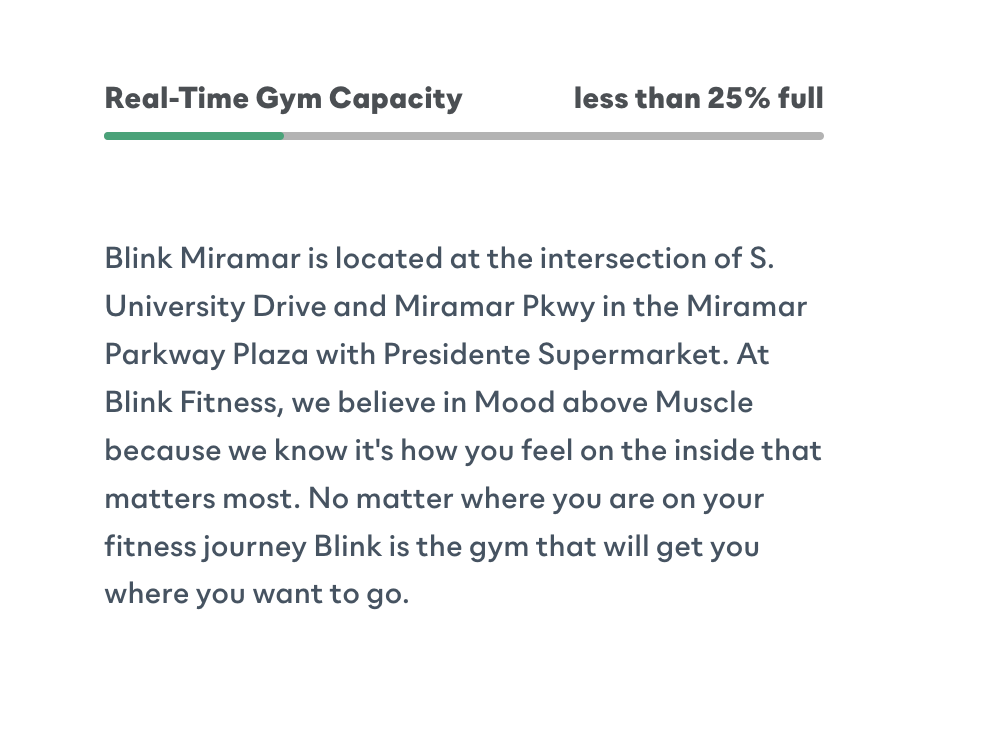
The feature was very successful, and it became a valuable part of the member experience. Members voiced to our front desk staff how often they use the feature (either by the app or the website) to plan their visit. But there was a problem: it only told members of how busy the gym was at that moment. How could we help members "plan their visit" in a way that empowered them to own their fitness journey?
Simultaneously, senior leaders were becoming more aware of our attrition numbers and identified one of the leading causes to be overcrowding. Overcrowding leads members to cancel because they can't get the equipment they need. If members could plan their visit ahead of time, or have data to inform them of the best time to go to the gym per hour, per day, we could see perhaps see a regression in chart data during busy hours. Thus, our business case was born.
Powering the Data
Our data and reporting team started to take ownership of the original data which was 1. how busy the gym was and 2. the capacity of that gym. We got a percentage for that time. That was easy. But we needed to start cataloging that data. We started entering those percentages into Amazon Timestream, which was a heavy query for our 100+ gyms. Over time, we started averaging out the data point (day, hour, and 5-minute intervals) for the previous 5 weeks. The team had then built out an API so that other teams could ingest this data and visually represent it.
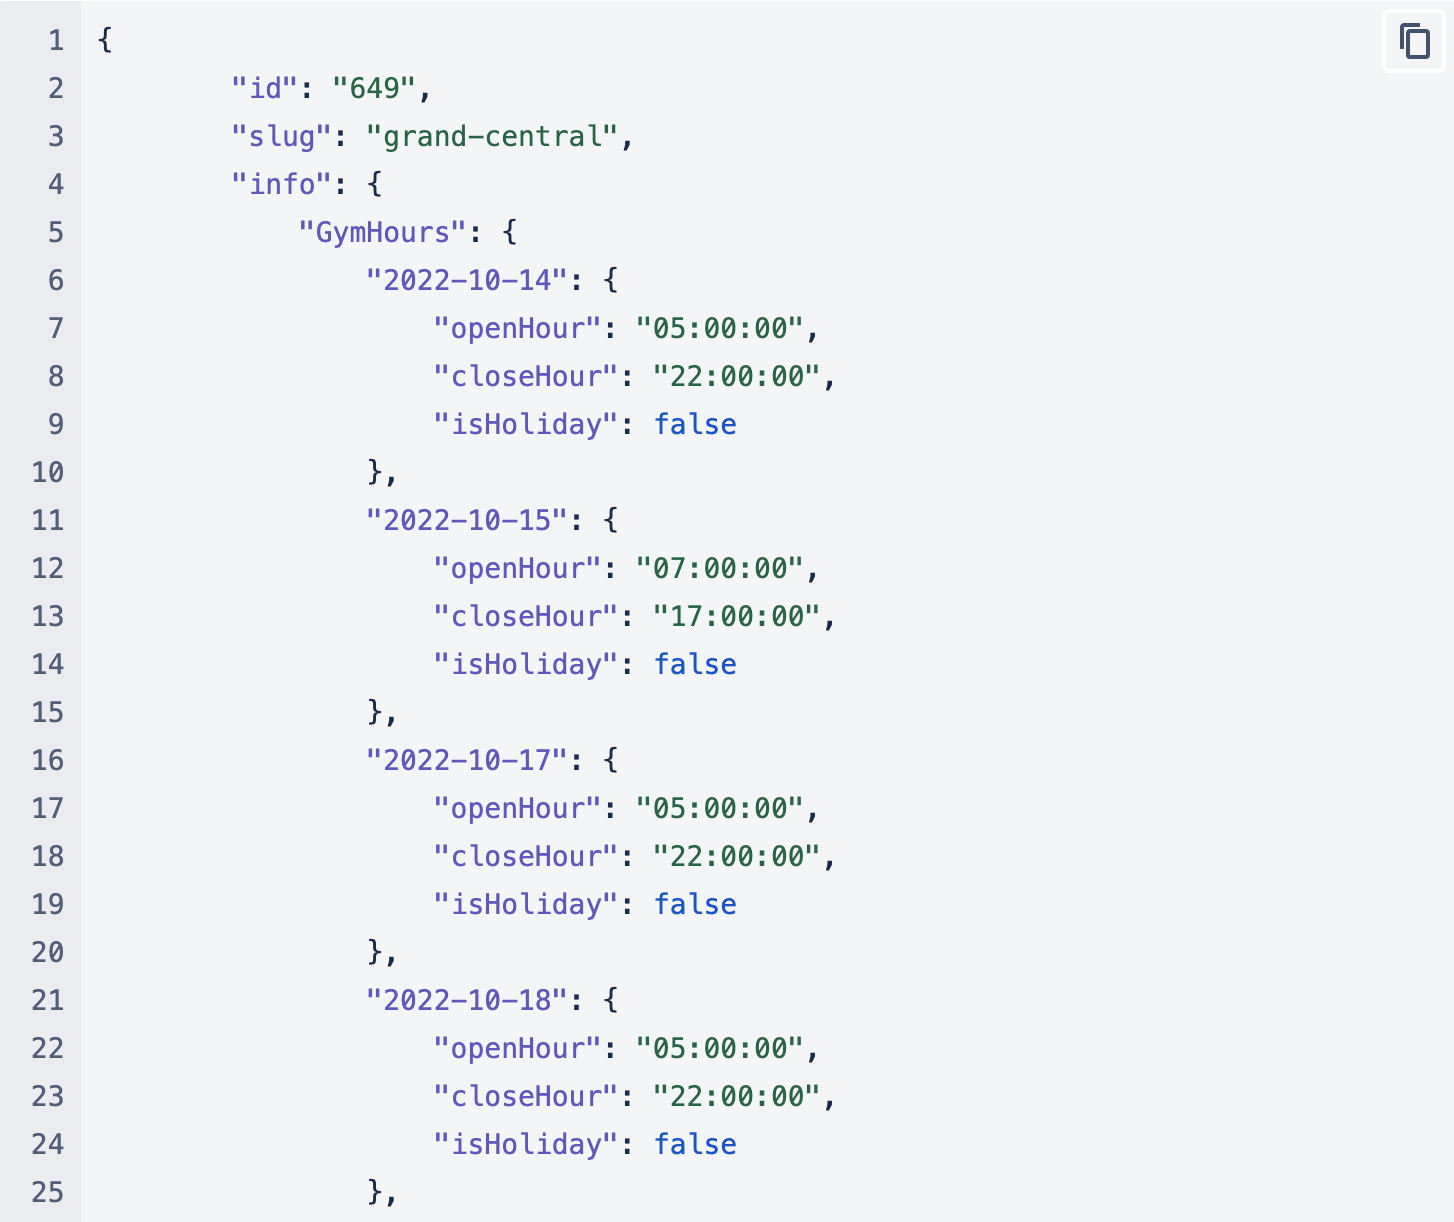
You can see in the response payload that I took some other things into account: holiday hours and hours of operation. I didn't want the front-end teams to worry about adjusting for that, so I had the API response include it. It was also imperative that the user understands that it's not 0 because no one visited the gym, but because the gym isn't open at that hour, or day.
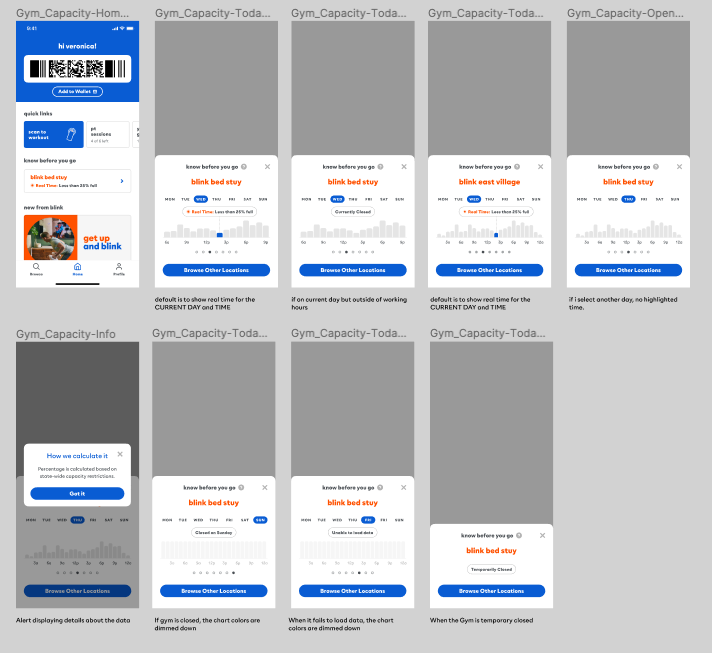
The User Experience
With the Blink App especially, there are a lot of different types of users and user access, so we had to account for that. But we also wanted to make this as simple as possible as it was our first iteration.
Measuring Success
I originally created a Product Requirements Document for the Crowd Meter as well, where I outlined how we would measure success for the feature.
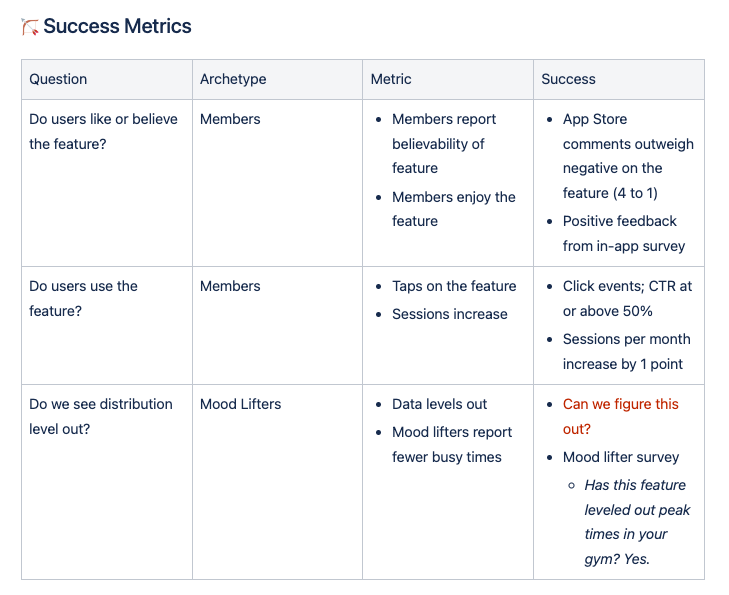
This is my absolute favorite part of the PRD, and a really good vision for everyone to be aligned with on (engineers, designers, stakeholders, etc.). It's building out the why of the product, and revisiting it when measuring success.
Moving Forward
Within the PRD are also the next steps, how to message the feature, and more. We ran into a slight issue with Android devices toward the end and are unable to release changes. But in the meantime, we are gathering feedback from iOS users and looking to see the impact on the business.
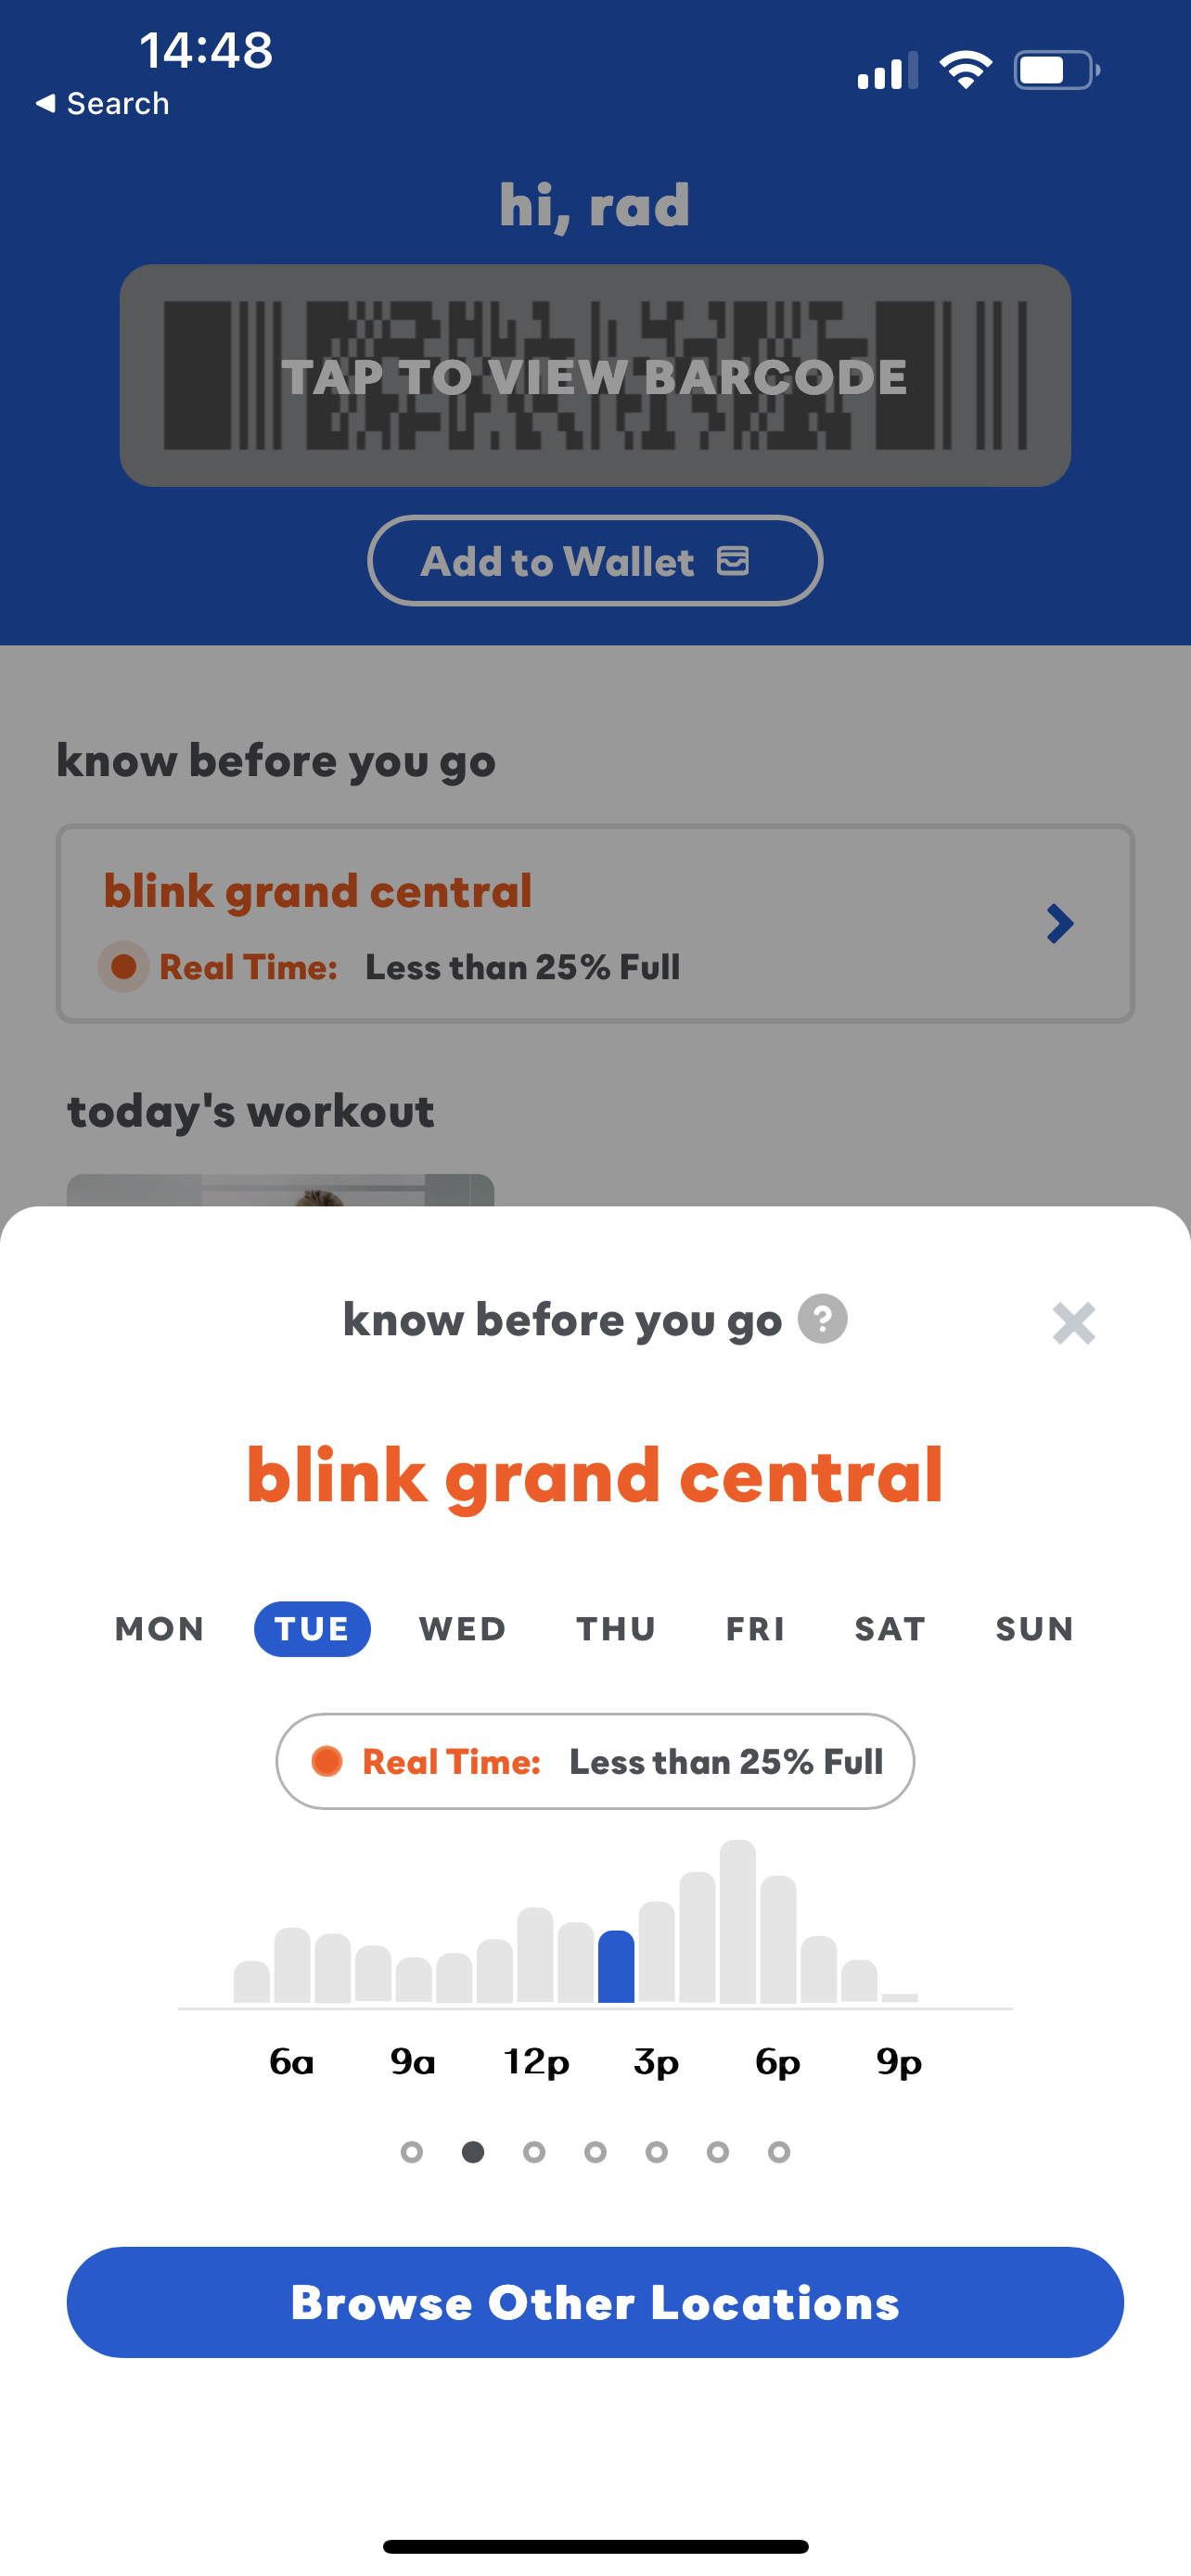
Screenshot of the production environment on my personal device.